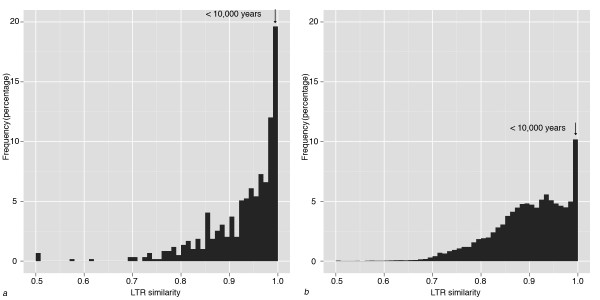
Figure 4.
Age distributions of LTR-retrotransposons in introns and genome. Distribution of LTR retrotransposon age represented by similarity between LTR regions (the higher similarity, the younger the elements) in a. large introns; b. V. vinifera genome. LTR pairs younger than 10,000 years are indicated by arrows

