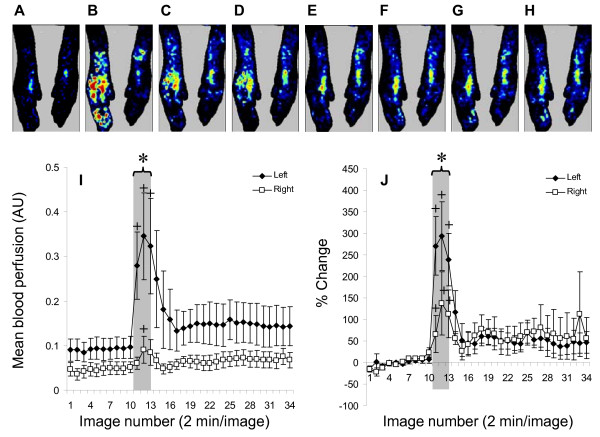
Figure 4.
Effect of stimulation of the central stump of the cut dorsal root on blood perfusion in hindpaws bilaterally. The upper panel shows laser Doppler images from one rat as control (A), during stimulation (B-D), and 2 (E), 14 (F), 32 (G), and 52 min (H) after the end of stimulation. Blue color indicates lower perfusion, whereas red color indicates higher perfusion. Time response curves are plotted for the raw data (I) and normalized changes in blood perfusion (J) in both the ipsilateral (Left) and contralateral (Right) hindpaws. The gray area indicates duration of stimulation (from image 11 to 13). Note +: p < 0.05 as compared to baseline, including all time points under the bracket. *: p < 0.05 as compared to the right side.

