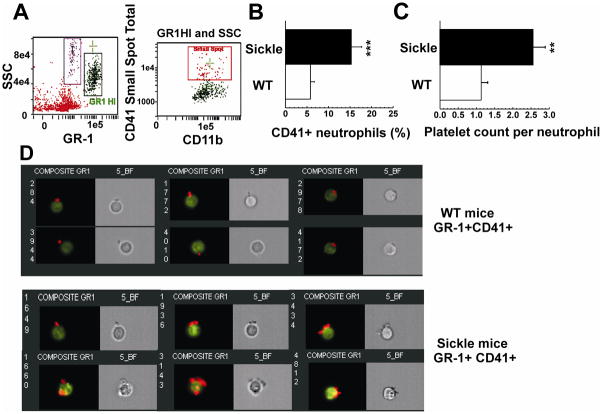
Figure 4. Images of platelet-neutrophil aggregates (PNAs).
(A) Peripheral blood cells were labeled with CD11b-Cy5-PE, GR-1-FITC and CD41-PE. Platelet-neutrophil aggregates were identified as GR-1 HI/CD11b+/CD41+ events and analyzed using the IDEAS™ software (AMNIS). (B) Quantitative analysis of CD41+ neutrophils in WT and SCD mouse blood shown in panel (D). Results are presented as means ± SD, n =3, *** p<0.001. (C) The number of platelets bound per neutrophil was determined by the Spot Count and Peak Intensity features of IDEAS software and calculated as the number of total platelets attached to CD41+ neutrophils divided by the number of CD41+ neutrophils in WT or SCD blood. Data are presented as means ± SD from 3 separate experiments, ** p<0.005 (D) Images of platelet-neutrophil aggregates are shown as Bright-Field illumination images (gray) and as composite images for six representative CD41+ neutrophils (of 21 WT and of 59 sickle neutrophils imaged). The composite images represent an overlay of the images from the 3 fluorescent channels (FITC, PE, and Cy5-PE) and demonstrate platelets (red/yellow) bound to neutrophils (green).

