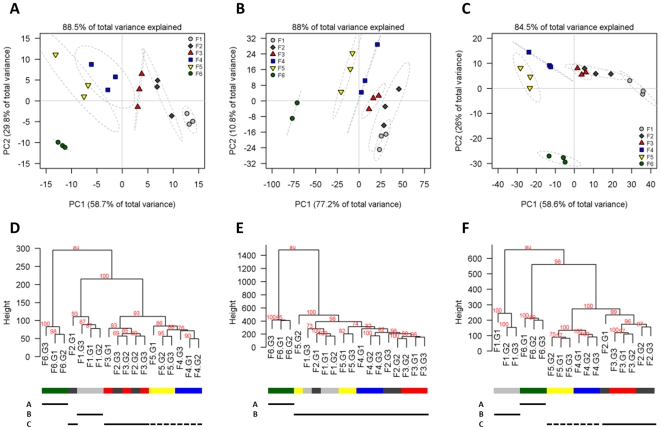
Figure 2. Principal component (PCA; A–C) and hierarchical cluster (HCA; D–F) analyses of metabolite data.
Both PCA and HCA plots demonstrate a good separation of the six fractions from each other independent of the three major compound classes, (A, D) primary, (B, E) lipophilic and (C, F) secondary metabolites. PCA and HCA were performed on scaled data. For PCA, data were additionally log2-transformed; HCA analyses are based on Euclidean distances among samples. Identical gradient fractions are encoded with the same color and shape as depicted in the graph legend. The 95% confidence ellipse is drawn as a grey dotted line on the basis of the mean, standard deviation, and correlation of the three independent gradient replicates per fraction. To aid interpretation of HCA graphs (D–F) same fractions are identically color-coded (see PCA legend) at the bottom sidebar. The unbiased cluster P-values, calculated using multiscale bootstrap resampling, are depicted as red-colored numbers at each node. The fraction groups explaining the highest variance of data and revealing a good cohesion within and separation among assigned fractions are depicted at the bottom of the HCA plots. Fraction groups, evaluated using resampling and gap statistic, were assembled by sequential merging of neighboring sample clusters with fractions assigned using membership majority voting (Figure S1). All graphs clearly support that the plastidic enriched, lowest density fraction F6 (group A) and to a lesser extent the vacuolar enriched, most dense fraction F1 are separated from the intermediately-dense fractions F2 to F5, even though for primary and secondary metabolite data two less-well separated fraction groups (F2–F3 and F4–F5) can be assumed (solid and dotted line; Figure S1).

