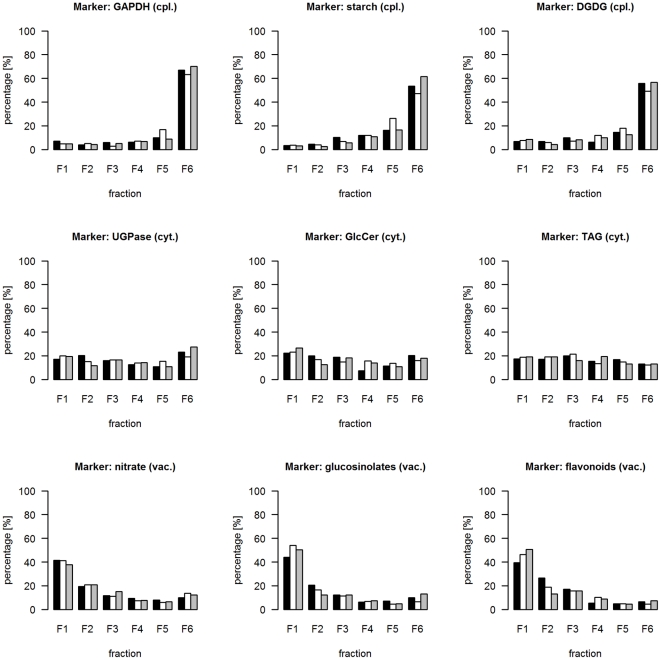
Figure 3. Side-by-side bar plots of marker distribution representing the same subcellular compartment throughout the three independent gradients.
For all graphs scaled data were used. Marker names are provided as graph headers including the compartmental representation, i.e. cpl. - plastidic, vac. - vacuolar, and cyt. – cytosolic compartment. The bars are colored as follows: gradient 1 - black, gradient 2 – white, and gradient 3 – grey. For DGDG (cpl.), GlcCer (cyt.), TAG (cyt.), glucosinolates (vac.), and flavonoids (vac.) the abundance per fraction is based on the robust average of multiple analytes representing the individual compound class (Data S4).

