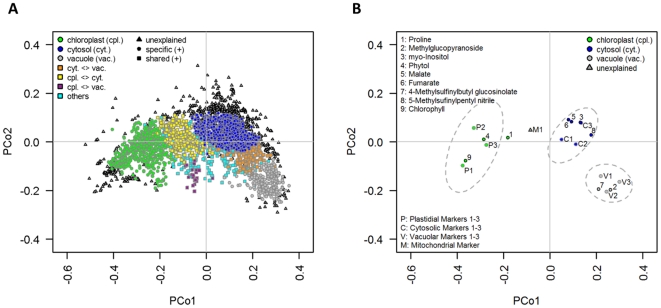
Figure 7. A topological map of the compartmentalized Arabidopsis thaliana leaf metabolome for (A) all and (B) selected analytes.
The classification for the partitioning of analytes into compartments and intermediate units is based on the best fit - estimated subcellular distribution as well as compartmental abundance and variability for each analyte (for details see Figure 6). The topological map (cf. Data S6 for single analytes) of the classification results for (A) all and (B) selected metabolites is visualized in principal coordinates (PCo) space on the basis of averaged Manhattan distances among analytes for the three independent gradients. To aid interpretation, analytes of the classes ‘specific’ and ‘dominant’ were both assigned into the respective compartment and color-coded accordingly: green – chloroplast, blue – cytosol, and grey – vacuole. Analytes assigned as being shared between two compartments are color coded as depicted in the figure. With exception of analytes with insufficiently explained (unexplained) subcellular distributions, all other analytes not belonging to one of the above-mentioned classes are defined as ‘others’.

