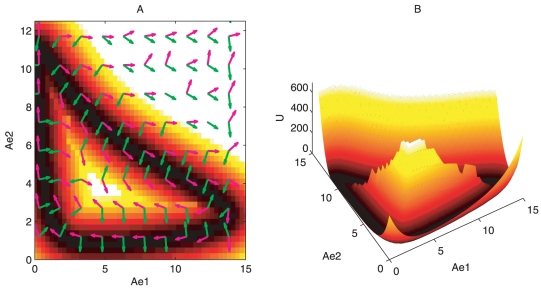
Figure 4. Landscape and probabilistic flux for oscillation state.
(A) shows the 2-dimensional landscape and probabilistic flux for oscillation state at D = 0.001, IPTG = 5, DD = 0.1125. Magenta arrows represent the flux flow vector, green arrows represent the negative gradient of potential energy. (B) shows the 3-dimensional landscape for predator prey network.

