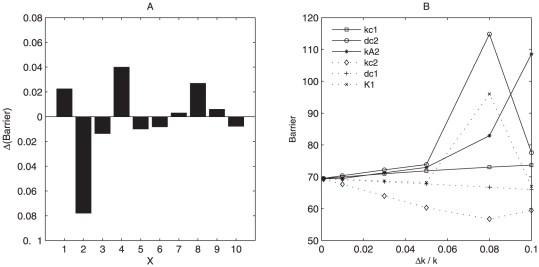
Figure 8. Sensitivity analysis.
(A) shows the effects of parameters on the barrier height at the same perturbation. x axis represent: 1:kc1, 2:kc2, 3:dc1, 4:dc2, 5:K1, 6:K2, 7:kA1, 8:kA2, 9:dAe1, 10:dAe2. (B) shows respectively the effect of 6 parameters on barrier height. Δk/k represents the percent of parameters increased.

