Figure 3.
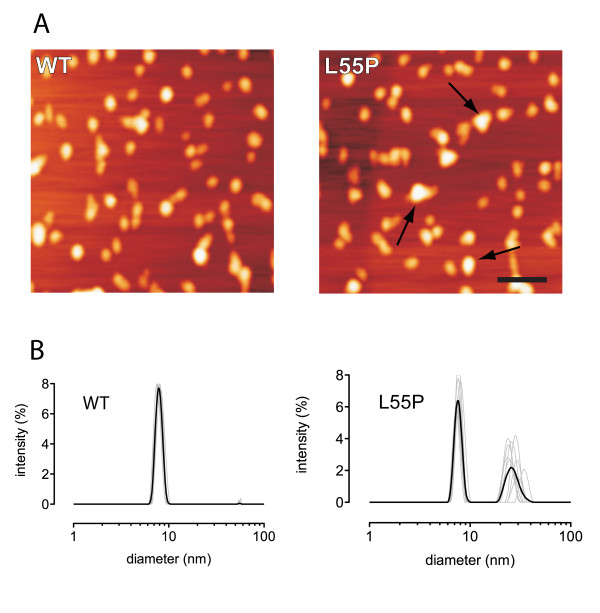
Analysis of TTR aggregation by AFM and dynamic light scattering. (A) Freshly prepared WT and L55P were examined using AFM. Representative AFM images show a relatively homogeneous dispersion of non-fibrillar particles in both WT and L55P preparations. Image analysis of particle cross-sectional area revealed a distribution of significantly larger L55P particle sizes (arrows) compared with those of freshly prepared WT protein (WT TTR 162 ± 63 nm2 compared with L55P TTR 263 ± 96 nm2, n = 86). Freshly prepared TTR protein was also examined using dynamic light scattering. (B) Protein samples were measured repetitively (replicates analyses in grey, mean of replicates in heavy black line) in a DLS every 30 min over a 4-6 hr time period by DLS. In addition to the native tetrameric molecule (7.66 ± 0.56 nm) corresponding to an estimated MW of 78 ± 5.7 kDa, a significant oligomeric species (29.38 ± 2.59 nm) corresponding to an estimated MW of 1810 ± 159.8 kDa, was detected in L55P samples compared to WT samples. Large molecular mass aggregates (>1000 nm in diameter) were not detected in protein preparations during the 4-6 hr analysis period. Scale bar is 100 nm.

