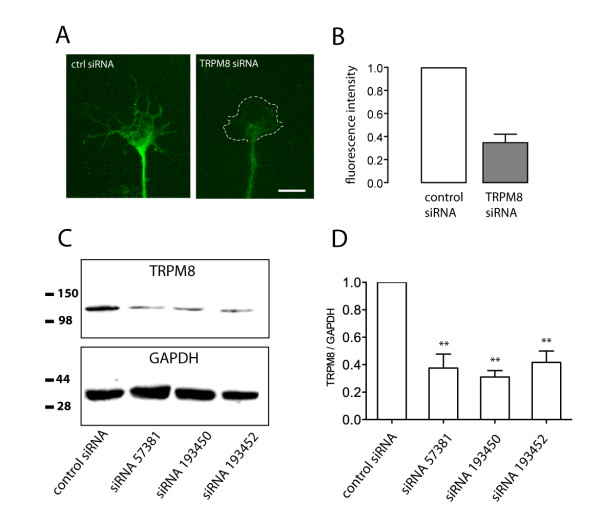
Figure 6.
siRNA silencing of TRPM8 expression. Figure shows the level of TRPM8 immunoreactivity as determined by immunocytochemistry and by western blotting after treatment with siRNA oligonucleotides. (A) TRPM8 staining of a DRG growth cone treated with a non-specific control siRNA or with a specific TRPM8 siRNA oligonucleotide (#57381). The dotted line describes outline of the growth cone in the TRPM8 siRNA culture. (B) Quantitative analysis of TRPM8 immunocytochemistry shows that there was a significant decrease in TRPM8 expression in the presence of the TRPM8 siRNA (#57381, n = 73 growth cones) compared with the non-specific control siRNA (n = 56 growth cones). (C,D) Western blot and quantitation of TRPM8 immunoreactivity after treatment with 3 different TRPM8 siRNA oligonucleotides and a non-specific control siRNA. (C) Extracts from siRNA-treated DRG cultures were applied to SDS gels and probed with an anti-TRPM8 antibody. (D) Quantitative analysis of blots revealed significant knockdown of TRPM8 protein expression compared to cultures treated with a non-specific control siRNA. TRPM8 siRNA levels were normalised to GAPDH expression. Figure shows 60-70% knockdown achieved with 3 separate TRPM8 oligonucleotides. Values are means of 9 replicate immunoblot lanes over 3 separate experiments. Significant differences from control are depicted as: ** p < 0.005 as determined by a Mann-Whitney U-test. Error bars show means ± SEM

