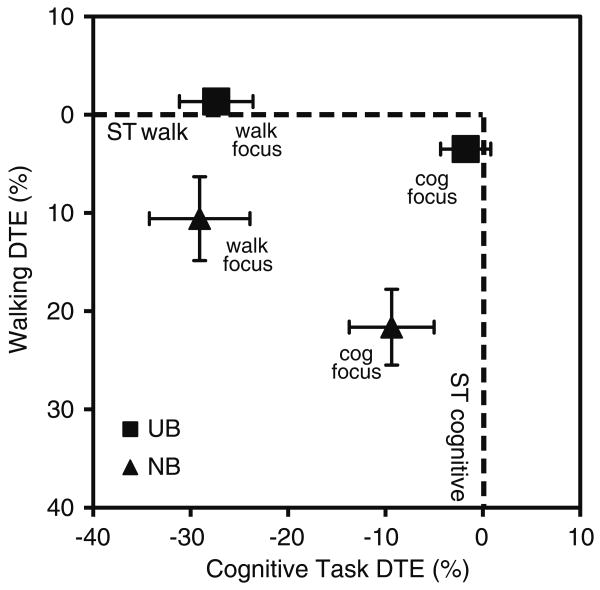
Fig. 4.
Performance operating characteristic framework showing the effects of instructed focus and task difficulty. Single task performance is represented by the dashed lines. The dual task effects for each point are reflected in the distance from each point to the line representing single task performance. Points represent means and bars represent standard errors (note standard errors for UB walking ≤1% in both cases)

