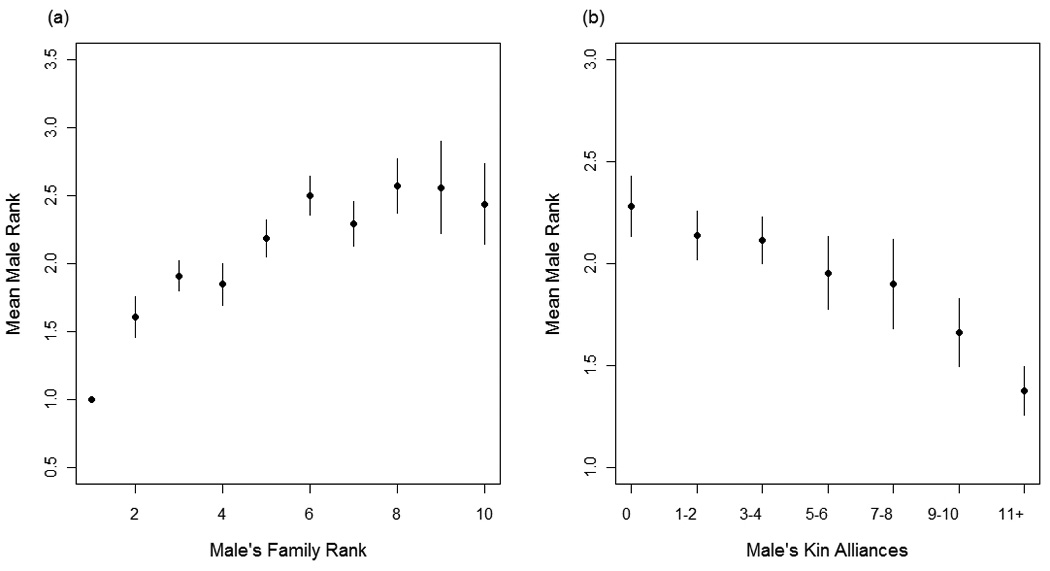
Fig. 3.

Mean male rank category, where high-rank = 1, mid-rank = 2 and low-rank =3, is plotted for: (a) all males from matrilines of a given rank and (b) males having different frequencies of kin alliances. The highest-ranking matriline is set to rank = 1. Vertical bars represent standard errors.
