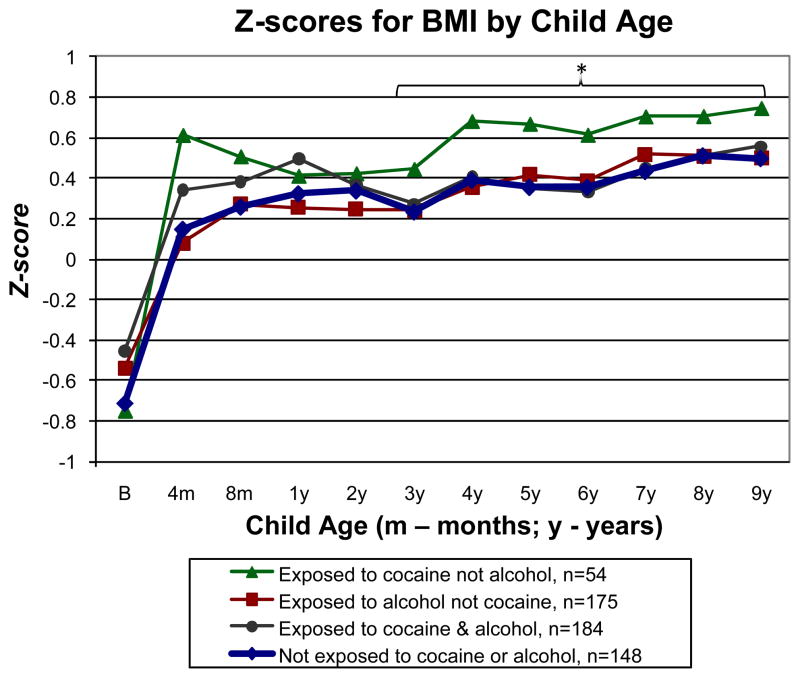
Fig. 2.
Longitudinal analysis of z-scores by age and sex for BMI from birth to 9 years by the 4 cocaine-by-alcohol exposure groups, adjusted for SGA, early weight gain from birth to 1 year, sex, and maternal prepregnancy BMI. *P<0.05 for significant differences between the group exposed to cocaine but not alcohol versus the group not exposed to cocaine or alcohol or the other 3 groups combined. Percentiles for age and sex from the CDC growth charts are included on the right Y axis for reference.

