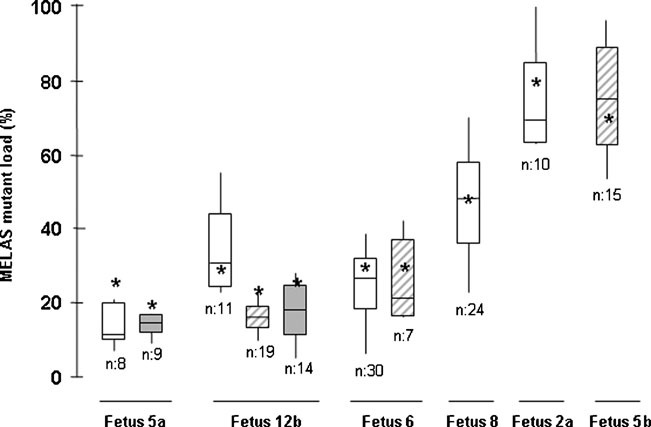
Figure 2.

Distribution of m.3243A > G mutation levels across isolated cells. MELAS mutant load was assessed in trophoblastic cells sampled at 10 GW (open boxes) and amniocytes sampled at 14 (hatched boxes) or 30 (filled boxes) GW in six fetuses (numbering refers to Table 4). n: number of analyzed cells. Each box depicts the mean mutant load plus (top bar), and minus 1 standard deviation (bottom bar) for a given cell pool. Whiskers depict maximal (top) and minimal (bottom) values for each sample. Central bar: median. *Mean mutant load assessed on the whole chorionic villi, or amniocyte sample.
