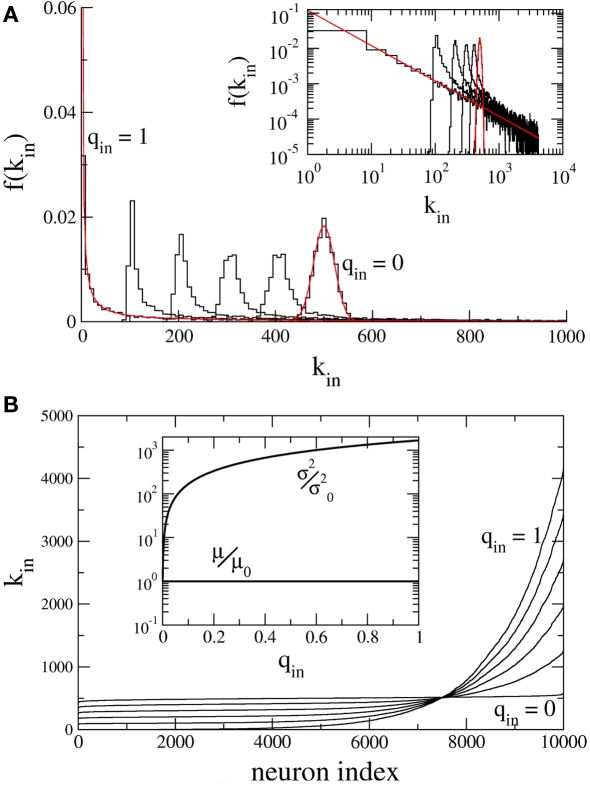
Figure 1.
Hybrid degree distributions are generated by interpolating between a binomial and a power-law. (A) The histograms of in-degree from a network of 10,000 neurons in which the out-degree distribution was binomial. Here qin = 0, 0.2, 0.4, 0.6, 0.8, 1.0. Inset: The same, but on a log–log scale. The analytical curves for the binomial and power-law distributions are shown in red. (B) In the same network as in (A), the neurons are ordered according to in-degree. Inset: As qin is varied, the mean in-degree is fixed by construction but the variance increases monotonically. μ0 and are the values of the mean and the variance for qin = 0.

