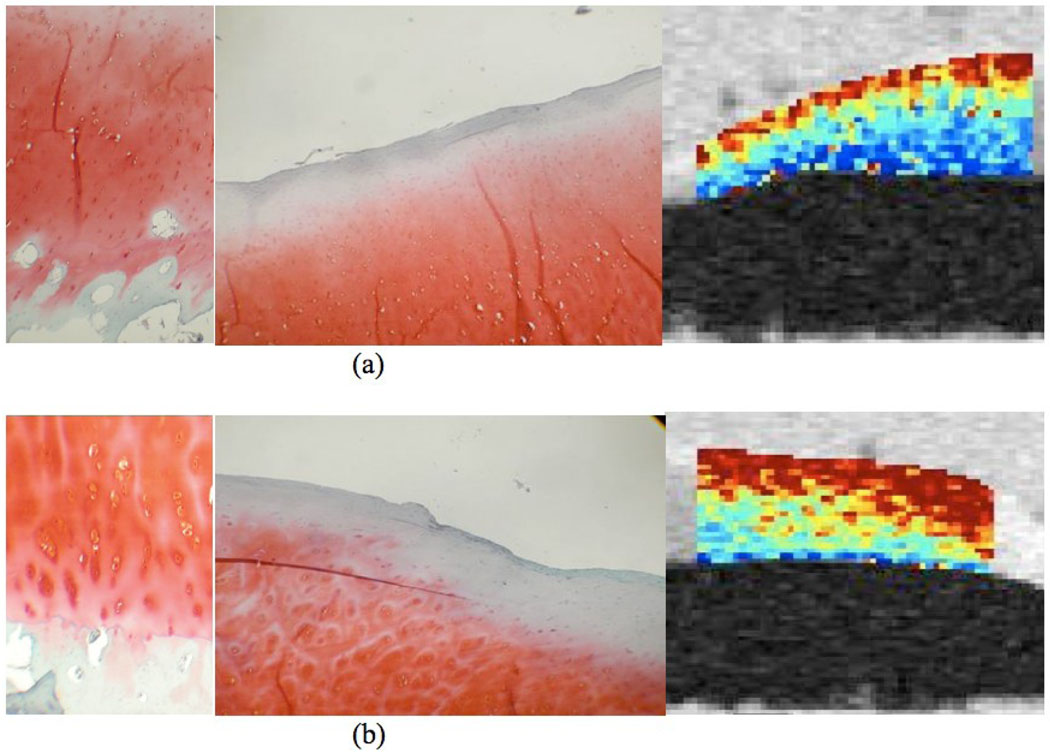
Figure 7.
Histology slides and T1ρ maps from a lateral tibial plateau specimen. (a) The anterior section received a low overall Mankin score of 2, because of the presence of mild surface irregularities and the infiltration of blood vessel across the tidemark (left). The Safranin-O staining shows no detectable loss (center), corresponding to a score of 0. The adjacent biochemistry core in the anterior has a relatively high GAG concentration of 4.97%. T1ρ agrees well with the histology and biochemistry findings, the region has a relatively low T1ρ value of 50.6 ± 31.3 ms (right); (b) The posterior section of the lateral tibial plateau received a higher overall Mankin score of 5, due to surface irregularities, pannus, cell cloning, and loss of safranin-O staining (left). The Safrain-O score was 1 due to focal loss of Safranin-O staining (center). The adjacent biochemistry core in the posterior has a relatively lower GAG concentration of 3.45%. T1ρ agrees well with these findings, and the posterior region has a relatively high T1ρ value of 77.1 ± 35.8 ms (right).

