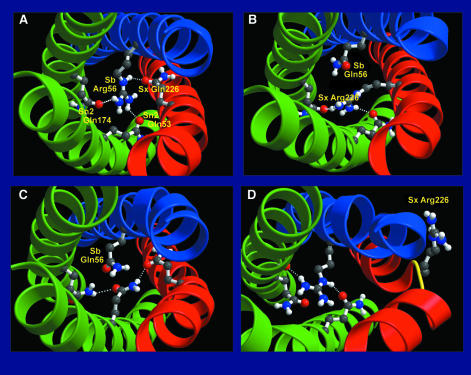
Fig. 10. Structures of the central ionic ‘0’ layer (snapshots) as obtained from 1 ns free energy perturbation simulations. The backbones of synaptobrevin, syntaxin and SNAP-25 are shown as blue, red and green ribbons, respectively; the four side groups of the ‘0’ layer are shown as ball-and-stick models. Hydrogen bonds are drawn as dashed lines. Shown are (A) WT structure after equilibration, as well as the calculated structures (B) of the R/Q double mutant, (C) the Q/Q mutant and (D) the R/R mutant. All plots were generated using Bobscript (Kraulis, 1991; Esnouf, 1997) and Raster3D (Merritt and Bacon, 1997).

An official website of the United States government
Here's how you know
Official websites use .gov
A
.gov website belongs to an official
government organization in the United States.
Secure .gov websites use HTTPS
A lock (
) or https:// means you've safely
connected to the .gov website. Share sensitive
information only on official, secure websites.
