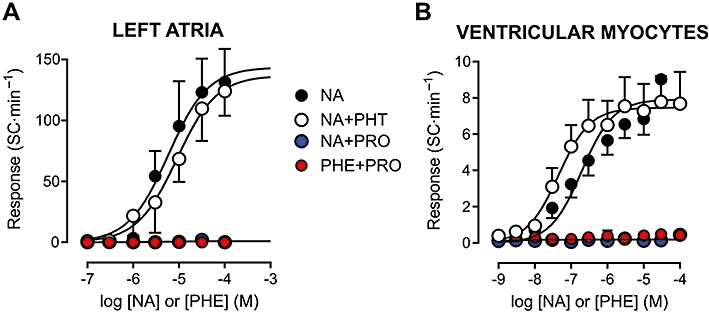
Figure 3.

Concentration–effect curves for adrenoceptor agonists in isolated rat left atria (A) and ventricular myocytes (B). The automatic response is expressed as the rate of spontaneous contractions (SC) during rest. Curves to noradrenaline (NA) were obtained in the absence of antagonists, as well as in the presence of the α- and β-adrenoceptor antagonists phentolamine (PHT, 1 µM) and propranolol (PRO, 1 µM) respectively. The response to the α-adrenoceptor agonist phenylephrine (PHE) was determined in the presence of PRO. Atropine (0.1 µM) was present throughout in all experiments with left atria. Values shown are means and SE. Curve parameters are shown in Table 1.
