
Figure 5.
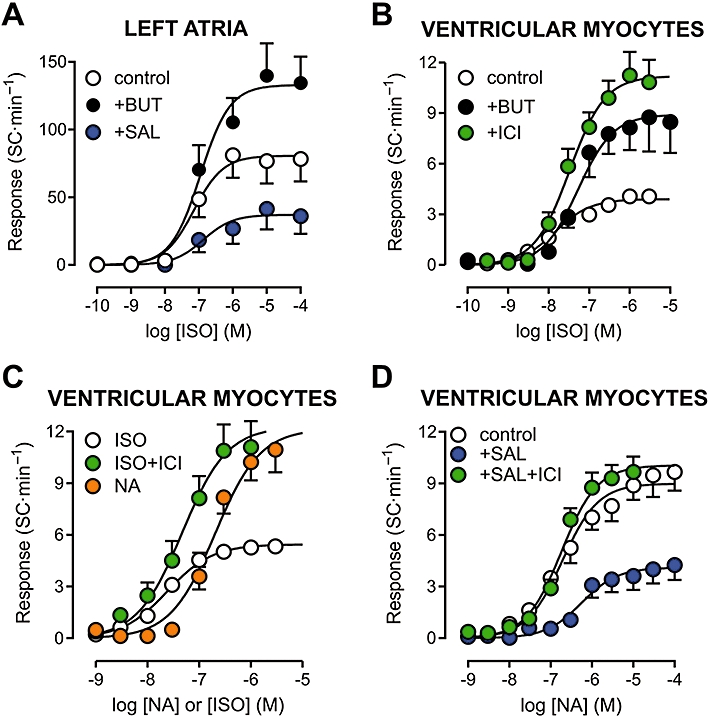
Concentration–effect curves for isoprenaline (ISO) and noradrenaline (NA) in isolated rat left atria (A) and ventricular myocytes (B–D). Curves were also determined during β2-adrenoceptor blockade with butoxamine (BUT, 0.3 µM) or ICI118551 (ICI, 0.1 µM), and in the presence of the β2-adrenoceptor agonist salbutamol (SAL, 10 µM). Experiments with left atria were performed in the presence of 0.1 µM atropine. Panels A and C show results obtained at 36°C, whereas the temperature was 23°C for experiments in panels B and D. Curve parameters are shown in Tables 1–3.