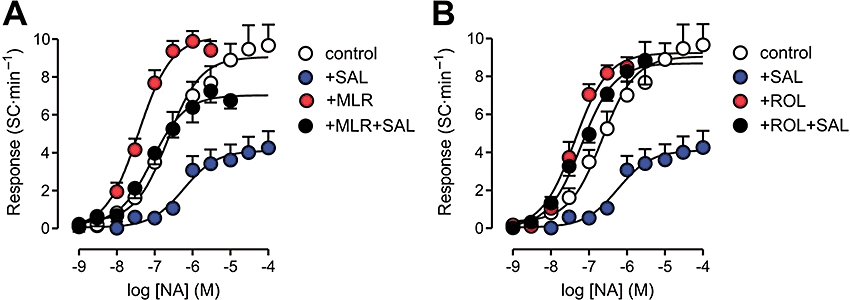
Figure 6.

Concentration–effect curves for noradrenaline (NA) in isolated rat ventricular myocytes, determined in the presence and absence of the phosphodiesterase inhibitors milrinone (MLR, 3 µM, panel A) or rolipram (ROL, 3 µM, panel B). Some curves were determined during perfusion with the β2-adrenoceptor agonist salbutamol (SAL, 10 µM). Curve parameters are shown in Table 2.
