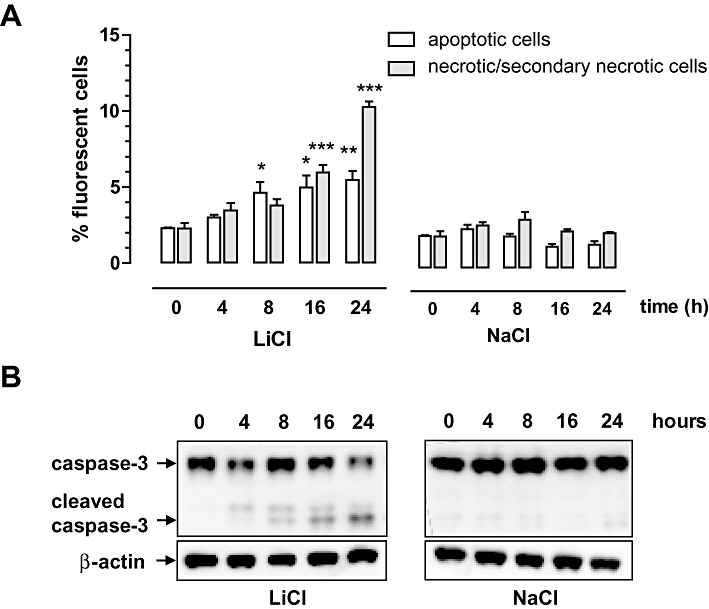
Figure 2.

Characterization of LiCl-induced macrophage death. J774A.1 macrophages were treated with 30 mM LiCl or 30 mM NaCl for 0–24 h. (A) Quantification of apoptotic cells (Annexin V-positive and 7-AAD-negative cells) and (secondary) necrotic cells (Annexin V- and 7-AAD-positive cells) via flow cytometry. Data represent mean ± SEM of three independent experiments. *P < 0.05; **P < 0.01 and ***P < 0.001 versus control (anova, followed by Dunnett test). (B) Western blot analysis of caspase-3 cleavage.
