
Fig. 6.
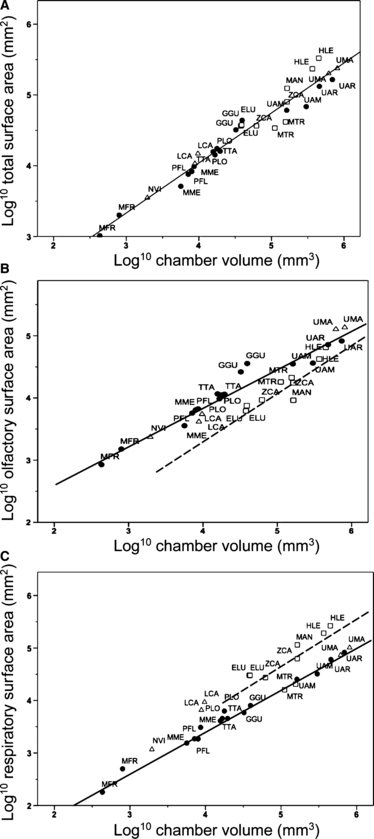
Log10/log10 plots of estimated surface areas against estimated nasal chamber volume. Symbols as in Fig. 4. Least-squares regression lines are indicated for all species in (A), terrestrial (solid line) and semi-aquatic species (dashed line) in (B,C). See Table 1 for species abbreviations and Table 2 for line equations and statistics.