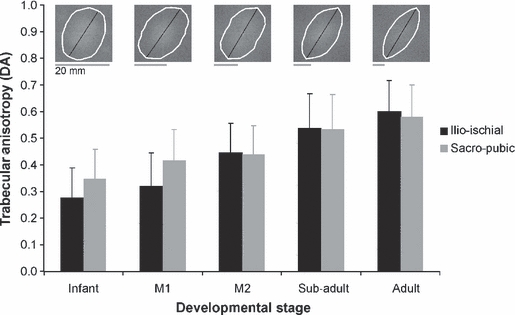
Fig. 2.

Ontogenetic variation in mean value and standard deviation in iliac trabecular anisotropy are shown for the sacro-pubic and ilio-ischial bundle, respectively. The typical change in anisotropy in the ilio-ischial bundle is illustrated at the top of the graph by rose plots (white ellipse).
