
Fig. 3.
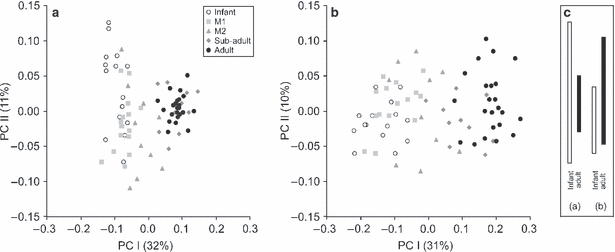
The first two components of the PCA for (a) external and (b) external and internal landmarks, separately. (c) The difference in variation between infants and adults along PCII is projected into a separate panel to illustrate the decrease and increase of variation with age for external (a) and combined (b) PCA, respectively.