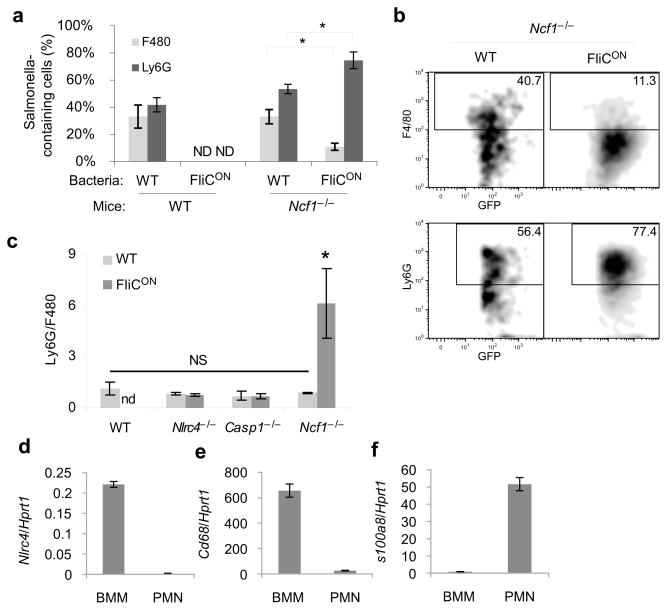
Figure 6. ST-FliCON accumulate within neutrophils.
(a–c) The indicated mouse strains were infected with GFP-expressing ST-WT or ST-FliCON for 48 hours (n=4 for each; results are representative of three experiments). GFP-containing splenocytes were interrogated for macrophage (F4/80) or neutrophils (Ly6G) markers by flow cytometry. (a) Percent marker positive cells and (b) representative individual plot are shown. (c) Ratio of GFP+ Ly6G+ to GFP+ F4/80+ cells determined by flow cytometry. (d–f) qPCR from BMDM or neutrophils (PMNs) for NLRC4, or macrophage (CD68) or neutrophil (S100a8) specific marker controls representative of three experiments. * = p < 0.05, NS = p > 0.05, ND = not detectable.

