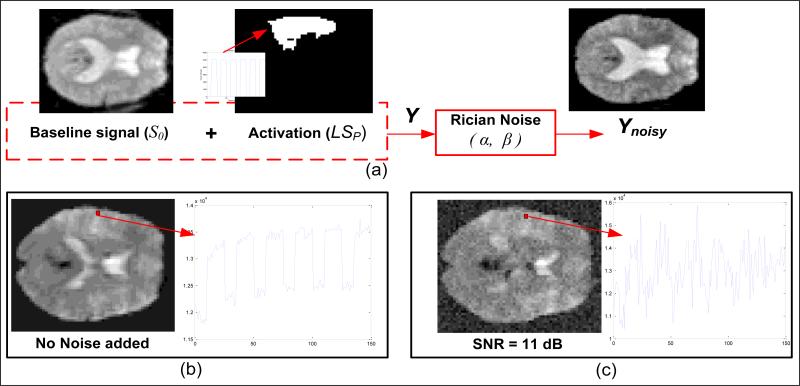
Figure 2. Software phantom data generation.
(a) Illustration of phantom data generation: a single slice depicting baseline intensity values along with the block design type task related time course and the ROI mask (temporal lobe). These are added together and input to the Rician noise model to obtain the noisy slice (Ynoisy); the bottom two figures depict the time course and intensity representations when (b) no noise is added, and when (c) there is added Rician noise.

