
Figure 2.
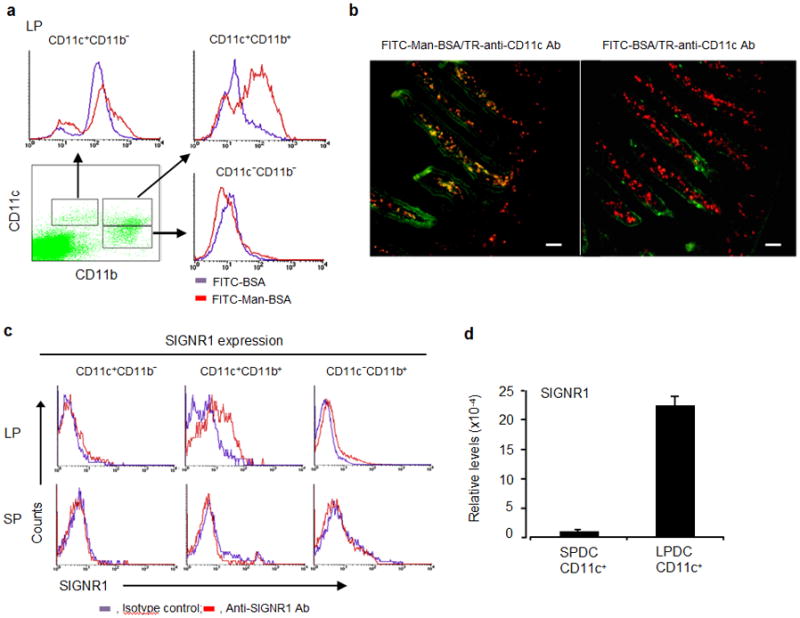
Man51-BSA targeted LPDC subset in lamina propria. (a) A representative flow analysis of three major LP DC or macrophage subsets in mice receiving oral administration of FITC-BSA or FITC-Man51-BSA (Man-BSA). (b) Immunocytochemical analysis of small intestine samples from the same groups of mice as above. Two-color merge pictures are shown. Scale bar, 50 μm. (c) Flow analysis of SIGNR1 expression in three cell subsets from lamina propria (LP) and spleen (SP). (d) The relative levels of SIGNR1 gene expression in LP CD11c+ or splenic CD11+ DCs, measured by the use of quantitative RT-PCR.