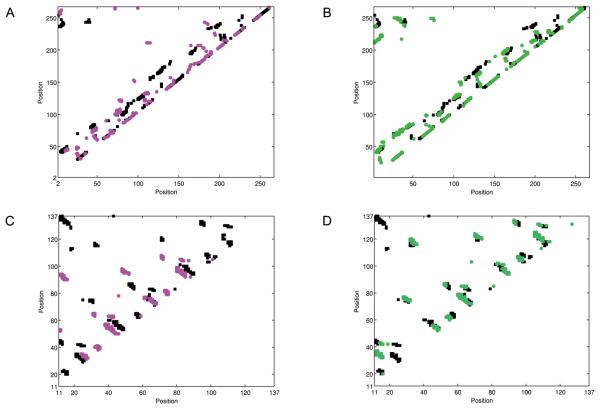
Figure 3.
Residue contact maps of target proteins indicated by target-template alignments. Two contact maps are compared for a target protein, one indicated from the top-scoring alignment and another one from a sub-optimal alignment which is the most correct in terms of residue contacts. A, the contact map of the target protein, 1ad1B, indicated by the top-scoring alignment with a template, 1dioA. Black, the actual contacting residues of 1ad1B; purple, contacting residues indicated from the alignment with 1dioA. B, the contact map of 1ad1B indicated by the 100th suboptimal alignment with the 1xyfA (green). C, the contact map of 1barA; black, the actual contacting residues of 1barA; purple, contacts indicated by the top-scoring alignment with a template, 1xyfA. D, residue contacts of 1barA indicated by the 70th suboptimal alignment (green).

