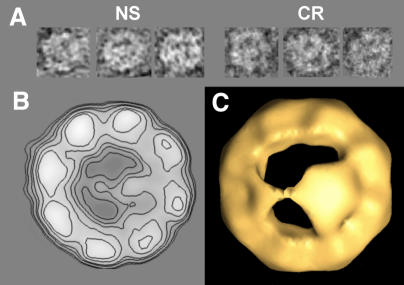
Fig. 1. Electron microscopy of CCT–β-tubulin complexes. (A) A gallery of top views obtained by negative staining (NS) or cryoelectron microscopy (CR). (B) Two-dimensional average of CCT–β-tubulin shown as contour lines (average of 2313 particles). (C) A view of three-dimensional reconstructions of the CCT–β-tubulin complexes obtained from stained specimens. Approximately 40 Å of the height of the CCT particle is reconstructed.

An official website of the United States government
Here's how you know
Official websites use .gov
A
.gov website belongs to an official
government organization in the United States.
Secure .gov websites use HTTPS
A lock (
) or https:// means you've safely
connected to the .gov website. Share sensitive
information only on official, secure websites.
