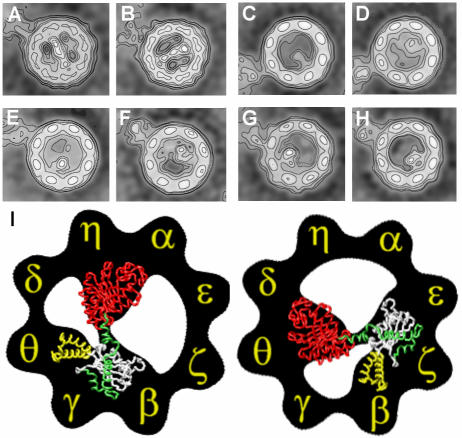
Fig. 5. Two-dimensional average images of immunocomplexes of CCT–tubulin and CCT–chimeric proteins. (A and B) Average images of CCT–tubulin–8g (anti-CCTδ) complexes (average of 527 and 491 particles, respectively). (C and D) Average images of CCT–Ha-Ras–β-tubulin fragment 5–PK-5h (anti-CCTθ) complexes (average of 345 and 381 particles, respectively). (E and F) Average images of CCT–Ha-Ras–β-tubulin fragment 3–8g (anti-CCTδ) complexes (average of 293 and 122 particles, respectively). (G and H) Average images of CCT–Ha-Ras–β-tubulin fragment 4–8g (anti-CCTδ) complexes (average of 208 and 220 particles, respectively). (I) A model depicting the two possible modes of tubulin interaction with CCT, using the CCT subunit orientation published by Liou and Willison (1997), which is fully consistent with the results obtained here. The colour codes are as in Figure 4A and C. All the average images shown in (A)–(H) are oriented as in (I).

An official website of the United States government
Here's how you know
Official websites use .gov
A
.gov website belongs to an official
government organization in the United States.
Secure .gov websites use HTTPS
A lock (
) or https:// means you've safely
connected to the .gov website. Share sensitive
information only on official, secure websites.
