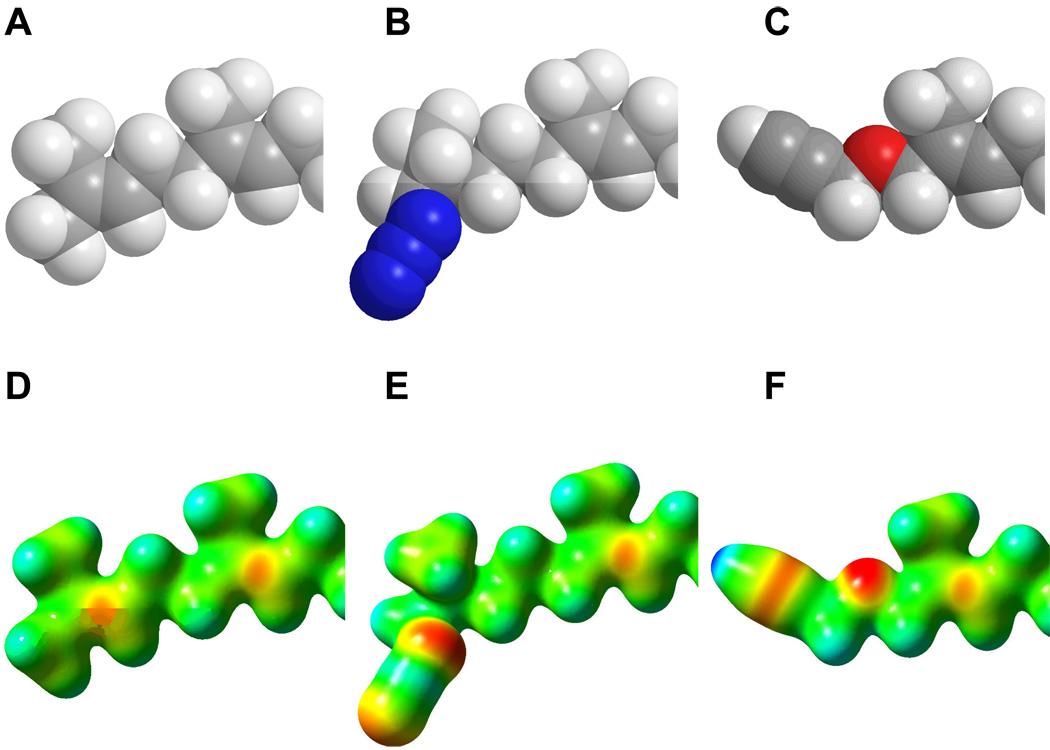
Figure 10.
CPK models and molecular electrostatic potential (MEP) maps calculated for FPP (1b), dihydroazide 5b and alkyne 6b. Top: CPK models of (A) FPP (1b); (B) 5b; (C) 6b. Bottom: MEP for (D) FPP (1b); (E) 5b; (F) 6b. For clarity, only cabons distal to C-5 are shown. Carbons 1–4 and the diphosphate groups are not shown since these are the same in all structures. For CPK models, the following colors were used: Carbon (grey), Hydrogen (white), Nitrogen (blue) and Oxygen (red). For MEP maps, potentials were plotted on a surface of constant density (density = 0.02). Electronegative areas are shown in red and electropositive areas are shown in blue.

