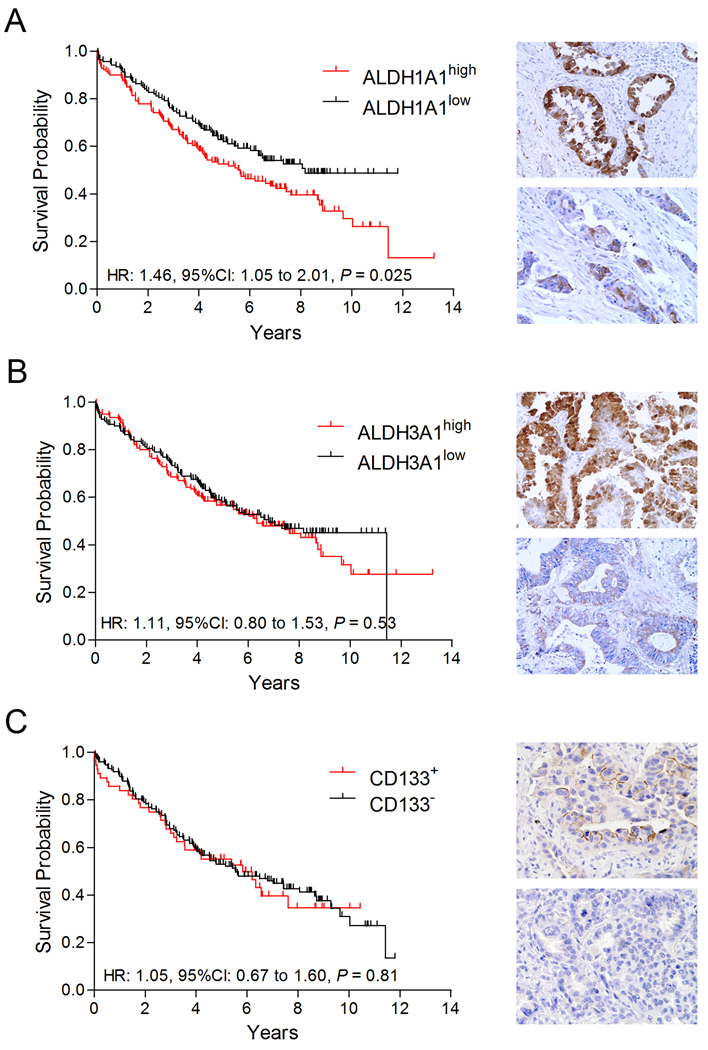
Figure 1. Survival analysis of NSCLC TMA samples expressing ALDH1A1, ALDH3A1 and CD133.
A. Kaplan-Meier plot (left panel) of patient overall survival based on tumors expressing high (red: n = 142) and low (black: n = 140) ALDH1A1 show high ALDH1A1 scores are associated with poor overall survival. B. Survival analysis of patients with tumors expressing high (red: n = 141) and low (black: n = 141) ALDH3A1 indicates no association between ALDH3A1 expression and overall patient survival. C. Similar analysis of patient samples expressing detectable CD133 (red: n = 56) and no CD133 (black: n = 151) indicates no association between CD133 expression and overall patient survival. Images taken from tumors with high (upper panel) and low (lower panel) protein expression are shown to the right of each corresponding survival curve.

