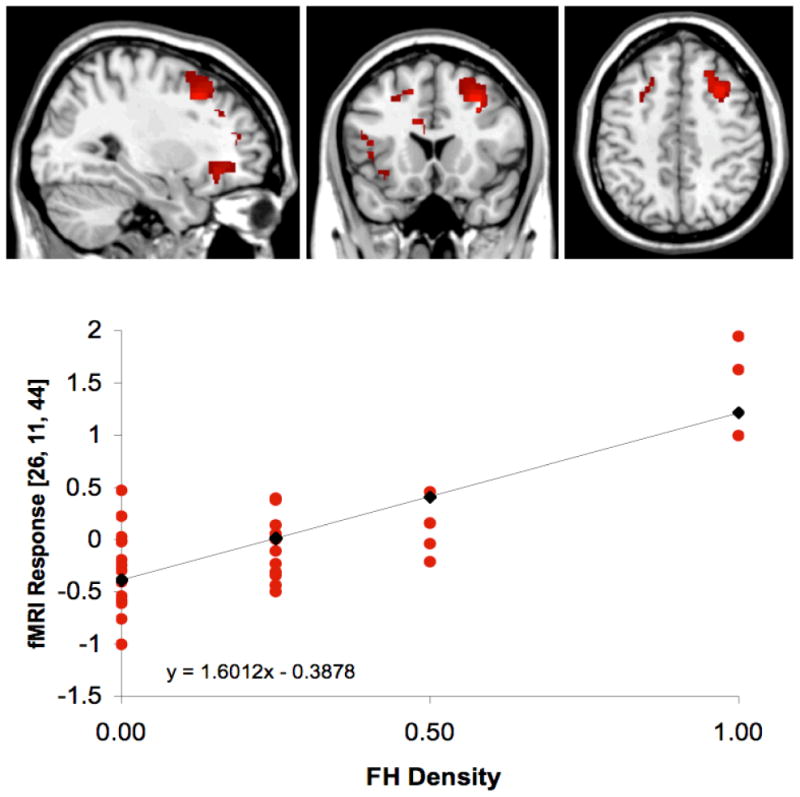
Figure 2. FHD Regression with Brain Activation for Interference – Color Naming.

Illustration of SPM maps demonstrating the significant positive regression (p<.05) between greater FHD and greater activation during the Interference condition of the Stroop task [Interference – Color Naming]. Local maxima coordinates were x=26, y=11, z=44, with 1108 activated voxels, SPM {t} = 6.64, significant at small volume corrected threshold, p<.05, and containing right MFG (BA8). L, left hemisphere; R, right hemisphere. Red circles represent individuals subjects and black diamonds represent average activation for each FHD group.
