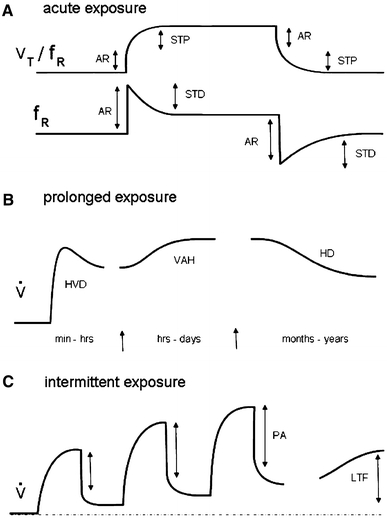
Fig. 1.

Schematic diagram of ventilatory responses after a brief (seceonds to minutes) hypoxic exposure (AR acute response, STP short-term potentiation, STD short-term depression); b prolonged (minutes to years) hypoxic exposure (HVD hypoxic ventilatory decline, VAH ventilatory acclimatization to hypoxia, HD hypoxic desnsitization) and c intermittent hypoxic exposure (PA progressive augmentation, LTF long-term facilitation) (modified after Powell et al. 1998) (V T tidal volume, f R breathing frequency, V total ventilation)
