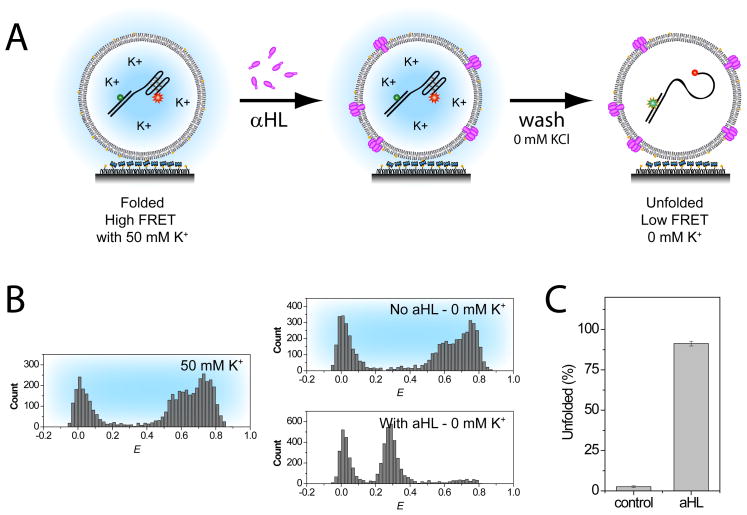
Figure 1. Permeability Assay.
The permeability of the membrane was tested with vesicle with and without aHL pores by flushing 0 mM K+ buffer. (A) The incorporation of aHL pores were done by incubation of surface immobilized vesicles. (B) While the control system showed no change in FRET distribution upon buffer exchange, a majority of the population shifted to mid FRET population (E 0.15–0.5), representing unfolded (U) GQ-DNA population, with vesicles treated with aHL (0.74 μM). The corresponding bar graph shows the percentage of unfolded GQ-DNA molecules after the addition of the low salt buffer.

