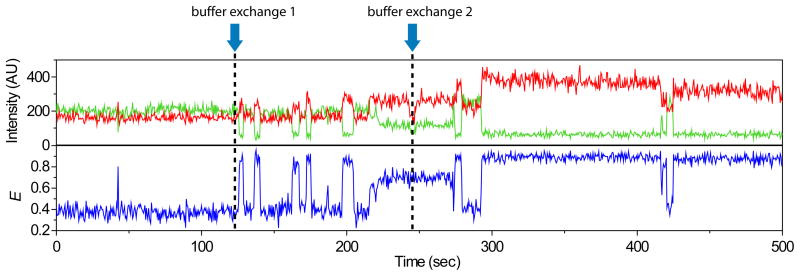
Figure 3. Successive Buffer Exchange.
Time trace of donor and acceptor intensities and corresponding E from a single molecule starting at 0 mM K+ condition and successive addition of buffers containing 2 mM and 10 mM K+ are shown above (0.5 sec integration time). The trace shows fluctuations between the unfolded (mid E state) and two folded states (high E states).

