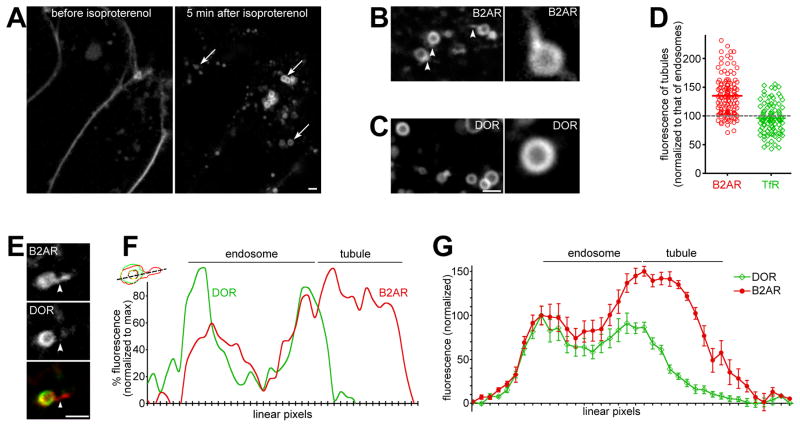
Figure 1. B2AR is enriched in endosomal tubular domains devoid of DOR.
A) HEK293 cells stably expressing FLAG-B2AR, labeled with fluorescently-tagged anti-FLAG antibodies, were followed by live confocal imaging before (left) and after 5 min (right) of isoproterenol treatment. Arrows show internal endosomes. B) Example endosomes showing tubular domains enriched in B2AR (arrowheads), with one enlarged in the inset. C) Examples of DOR endosomes. DOR is smoothly distributed on the endosomal membrane, and is not detected in tubules. D) Average fluorescence of B2AR (red circles) and TfR (green diamonds) calculated across multiple tubules (n= 123 for B2AR, 100 for TfR). B2AR shows a 50% enrichment over the endosomal membrane, while TfR is not enriched. Each point denotes an individual tubule, the bar denotes the mean, and the grey dotted line denotes the fluorescence of the endosomal membrane. E) An endosome containing both internalized B2AR and DOR, showing a tubule containing B2AR but no detectable DOR (arrowheads). F) Trace of linear pixel values across the same endosome, normalized to the maximum, confirms that the tubule is enriched for B2AR but not DOR. G) Linear pixel values of endosomal tubules averaged across 11 endosomes show specific enrichment of B2AR in tubules. Error bars are s.e.m. See also Fig S1 and movies S1 and S2.

