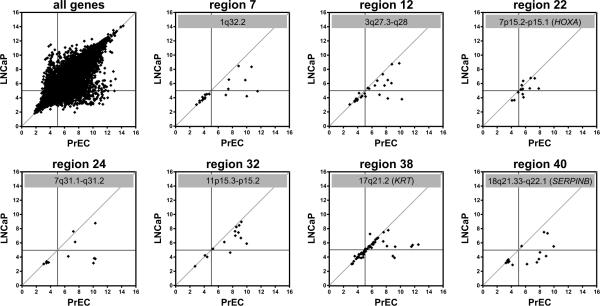
Fig. 2. Expression status of LRES regions in PrEC and LNCaP cells.
RNA samples of normal prostate epithelial cells (PrEC) and the prostate cancer cell line LNCaP were analysed on Gene 1.0ST microarrays and all hybridisation signals (log2) were plotted as scatter plots (top left panel). The horizontal and vertical lines in each panel indicate the detection thresholds (hybridisation signal below 5.0), while the line x = y indicates equal transcripts levels in PrEC and LNCaP cells. Scatter plots are shown for seven example LRES regions, identified from clinical prostate cancer samples that also display concordant gene suppression in LNCaP cells.

