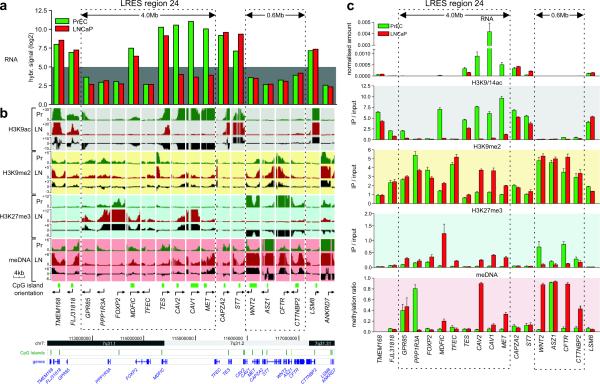
Fig. 3. Epigenetic landscape of 7q31.1-q31.2 in LNCaP and PrEC cells.
(a) Expression analysis of LRES region 24 (7q31.1-q31.2) in LNCaP and PrEC cells by microarray hybridisation signals. The grey background highlights signals below detection (hybridisation signal below 5.0). (b) H3K9ac, H3K9me2, H3K27me3 histone modification and DNA methylation was analysed using Affymetrix GeneChip human promoter 1.0R tiling arrays. For each gene and each modification, the enrichment over input status is shown as well as the differential pattern (Pr [green tracks]: PrEC; LN [red tracks]: LNCaP; Δ [black tracks]: LNCaP minus PrEC). The dotted boxes highlight repressed domains that show distinct reorganisation of chromatin modifications and DNA methylation corresponding to the more silent state across the LRES region 24 of 4.0Mb from GPR85 to MET. The boundary genes TMEM168, FLJ31818, CAPZA2 and ST7 do not gain repressive marks and show high levels of K9 acetylation in both cell lines. A downstream region of 600 kb is also shown, covering WNT2, ASZ1, CFTR and CTTNBP2. This region is already silent in PrEC but is remodelled in LNCaP with a loss of H3K27me3 and a gain in DNA methylation. Genomic information of the region was taken from UCSC Genome Browser. (c) Validation of the tiling array results. Real-time qPCR was used to validate gene expression and ChIP-on-chip results, while Sequenom DNA methylation analysis was used to validate the MeDIP-on-chip results. Results of triplicate experiments are shown (average plus S.E.M.).

