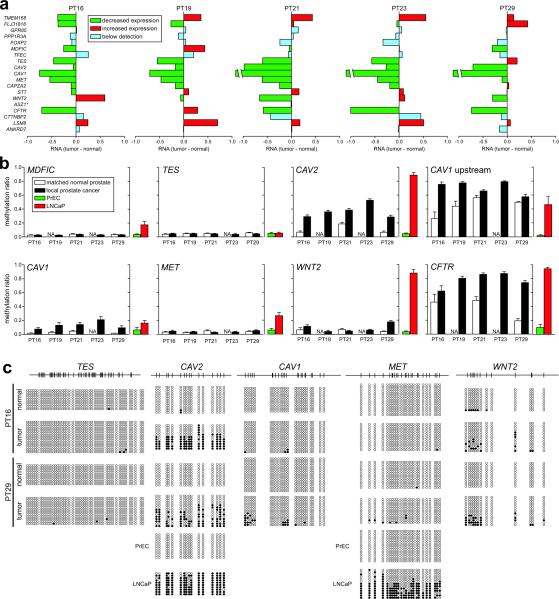
Fig. 4. Epigenetic suppression of 7q31.1–q31.2 in clinical prostate cancer samples.
(a) Gene expression changes for genes within LRES region 24 in five pairs of local prostate cancer and adjacent normal tissue. Reduced expression of consecutive genes in individual clinical samples across the LRES region 24, from Experiment Set 165; (green: reduced expression; red: increased expression; blue: below detection [log2 signal < 5.0]; *: ASZ1 was not interrogated on these expression arrays.) (b) Quantitative DNA methylation Sequenom MALDI-TOF analysis of genomic DNA from the same clinical samples. Average methylation ratios across the interrogated regions are shown. For comparison, the average methylation ratios for PrEC and LNCaP cells are also graphed. It can be clearly seen that within a sample, multiple genes within the region are DNA hypermethylated, e.g. in patient 29 (PT29) hypermethylation was observed in the CAV2, CAV1, WNT2 and CFTR promoters. CAV1 upstream is a genomic region immediately upstream of the CpG island in the promoter of the CAV1 gene. (c) DNA methylation levels in two clinical samples, patient 16 (PT16) and 29 (PT29), were further interrogated by clonal bisulphite methylation sequencing. Black and white circles indicate methylated and unmethylated CpG sites respectively and each row represents a clone. The CAV2, CAV1 and WNT2 promoters showed signs of hypermethylation in both cancer samples while TES and MET were essentially unmethylated. For comparison, clonal bisulphite sequencing results are shown for CAV2 and MET in PrEC and LNCaP cells.

