
Fig. 10.
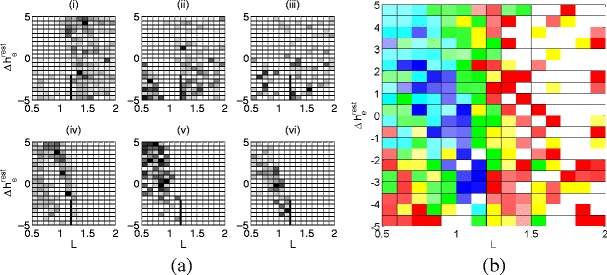
Association between EEG data set sc4002e0 and the sleep manifold. Each picture shows the sleep manifold in L- space, with a heavy black line to indicate the location of the fold. (a) Histograms of nearest neighbors for (i) waking, (ii) REM, (iii) stage 1, (iv) stage 2, (v) stage 3, and (vi) stage 4 sleep. The shading of each square indicates the number of times that location on the sleep manifold was a nearest neighbor of EEG data in that stage. For example, (vi) shows that stage 4 sleep most often associates itself with the lower NREM branch of solutions leading up to the fold. (b) A composite picture of the results in (a), where each location is colored based on the sleep stage with the most neighbors at that point, relative to the total number of neighbors associated with that stage. Again, we use stage 1 (yellow), stage 2 (green), stage 3 (cyan), stage 4 (blue), and REM (red). The intensity of color is scaled based on the percentage of neighbors that come from that stage; the more saturated the color, the greater the percentage. Waking points were excluded