
Fig. 12.
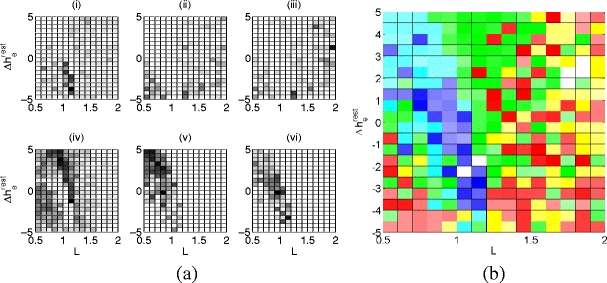
Combined association between all four EEG data sets and the sleep manifold. The data set sc4002e0 was directly compared to the cortical model using LLE, and the remaining three data sets were projected onto those results as described in Section 5.4. (a) Total histograms of nearest neighbors, separated by sleep stage; these were calculated by summing the histograms from all four EEG data sets. The pictures show awake, REM, and stages 1–4 in (i) through (vi), respectively. (b) The total composite picture for all four data sets. This was generated from the histogram data in (a) and is analogous to Figs. 10(b) and 11. Again, this is consistent with previous results and shows the regions of the sleep manifold most closely associated with each sleep stage