
Fig. 4.
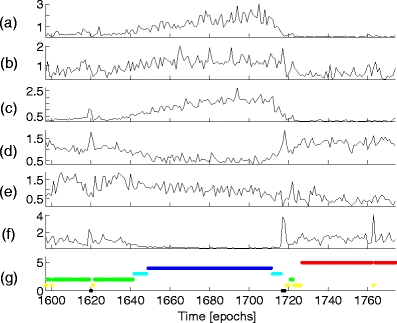
Scaled features of EEG data set sc4002e0, as described in Section 4.2. The subfigures show power in the (a) delta and (b) theta bands, (c) variance, (d) spindle score, (e) maximum height of the power spectrum in the alpha band after subtraction of a linear estimate, and (f) high power fraction. Figure (g) shows the hypnogram of the EEG data, where the number and color indicate the sleep stage: awake (0, black), stage 1 (1, yellow), stage 2 (2, green), stage 3 (3, cyan), stage 4 (4, blue), and REM (5, red). The features were calculated for the data from epochs 1,597–1,774 in 30-second windows with no overlap