
Fig. 6.
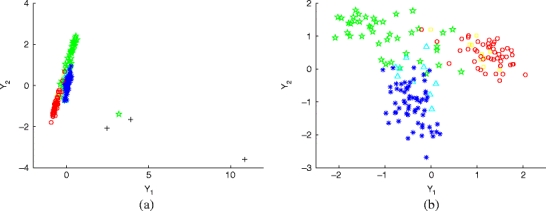
LLE results on sleep EEG data before (a) and after (b) removal of eight weakly connected points. The six features were power in the delta, theta, and gamma bands, total power, maximum height of PSD above a linear estimate in the alpha band, and low power fraction, and we used k = 13. As before, the color and symbol indicate sleep stage: awake (black +), stage 1 (yellow
 ), stage 2 (green ⋆), stage 3 (cyan ∆), stage 4 (blue ∗), and REM (red ∘). Note the dramatic improvement in separation between sleep stages when LLE is done on only one strongly connected component in (b)