
Fig. 9.
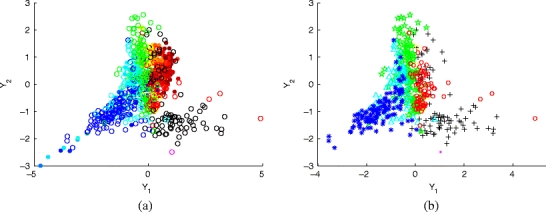
(a) LLE results for a hybrid data set containing both sleep EEG data and numerical solutions of the cortical model. We used the five features from Fig. 7 and set k = 14. The rings represent EEG data and are colored by sleep stage. While the analysis included 1,200 windows of EEG data, only 500 are displayed here for clarity. The solid dots represent data from the model; they are colored based on the mean value of h e at that point, where red represents the highest (REM) values, and dark blue marks the lowest (NREM) values. Note that the data and model points overlap in the output space and that the arrangement of sleep stages is very similar. (b) LLE results showing the EEG data only, using the same colors and symbols as Fig. 6. This allows us to see that the data has been roughly separated by sleep stage