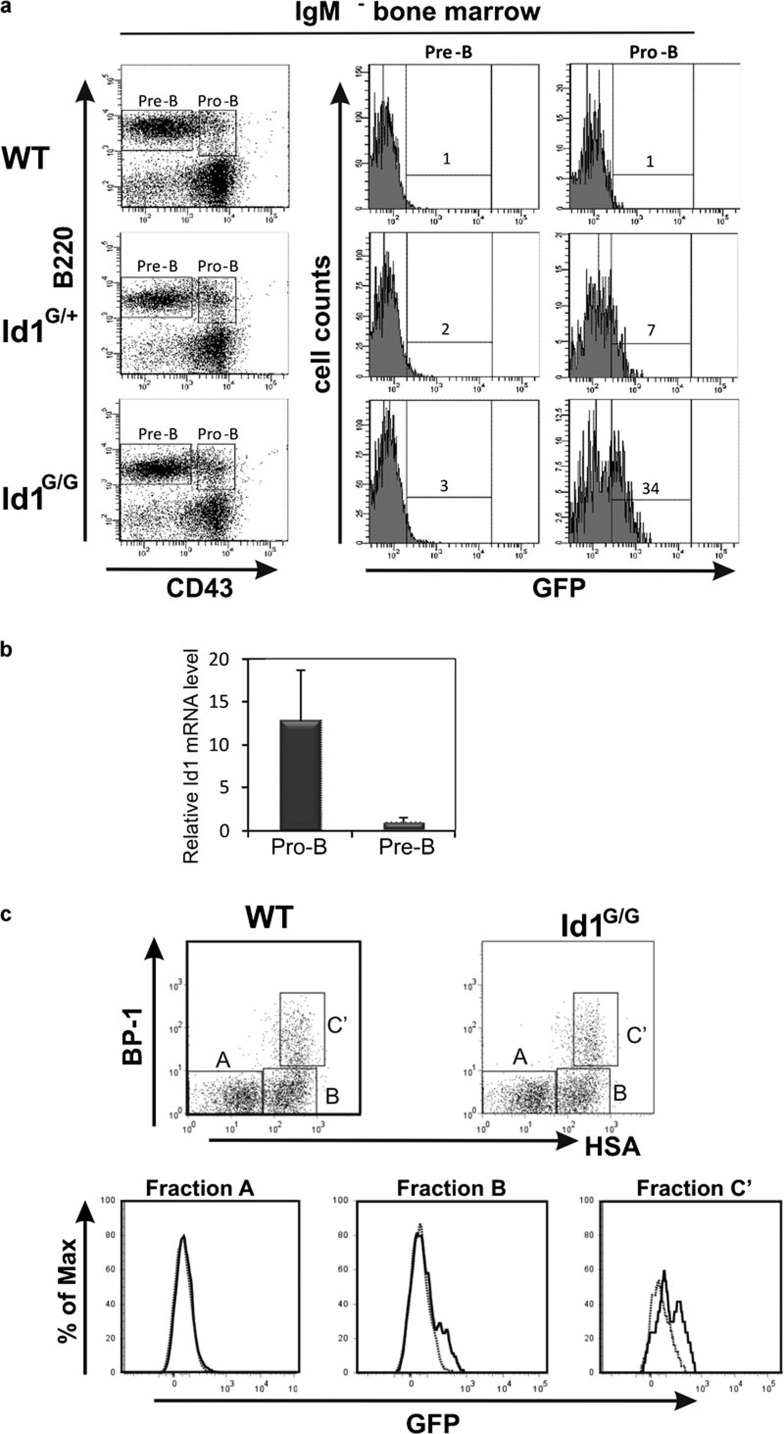
Figure 4.
Id1 is expressed in fraction B and C′ subsets of pro-B cells in the bone marrow. (a) Bone marrow cells from WT, Id1+/G and Id1G/G mice were harvested and stained with IgM, B220 and CD43 antibodies to delineate pre- and pro-B cell populations as indicated. Histograms show the level of GFP expression in the indicated subsets from mice of the indicated genotypes. GFP-positive gates in histograms were based on a 1% background in WT control bone marrow subsets. (b) Real-time RT-PCT assay for Id1 mRNA levels in pro-B and pre-B cells defined as in (a). Levels of transcripts were normalized against that of β-actin by calculating △CT. Data shows the average±SD, which was calculated as described.58 (c) B220+CD43+ cells from WT and Id1G/G mice were analyzed for BP1 and HSA expression to delineate fractions A, B and C′ as shown in the dot plots. Histograms of GFP expression in WT (dotted line) and Id1G/G (solid line) mice are superimposed and shown for each fraction. GFP, green fluorescent protein; HSA, human serum albumin; RT, reverse transcription; WT, wild type.

