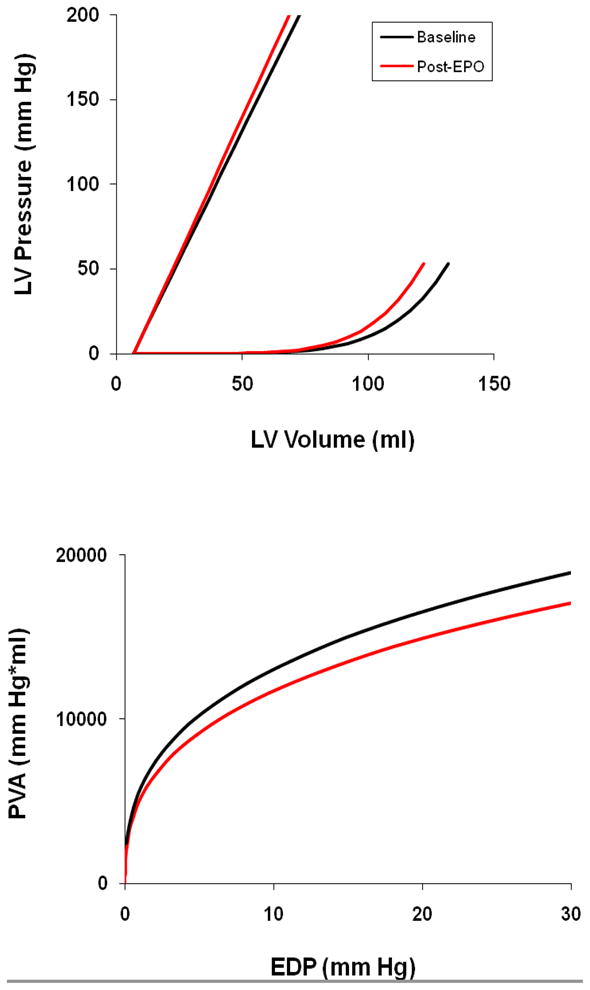
Figure 2.

Group average end systolic and end diastolic pressure volume relations for subjects at baseline (black) and after 3 months of treatment with erythropoietin (red) [upper panel]. The isovolumetric pressure volume area versus estimated EDP at baseline (black) and after 3 months of treatment with erythropoietin (red) [lower panel].
