
Figure 4.
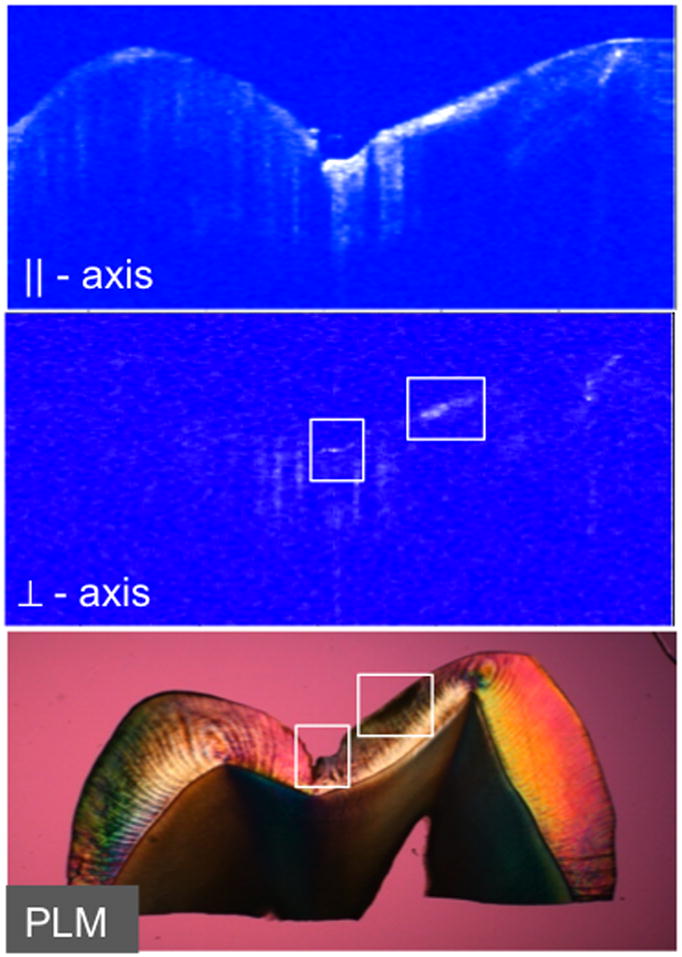
PLM and PS-OCT images of the occlusal surface of the premolar of one premolar after 30-days centered on the incision. Areas of demineralization are shown in the white boxes in the CP PS-OCT (⊥–axis ) and PLM images.
Official websites use .gov
A
.gov website belongs to an official
government organization in the United States.
Secure .gov websites use HTTPS
A lock (
) or https:// means you've safely
connected to the .gov website. Share sensitive
information only on official, secure websites.
PLM and PS-OCT images of the occlusal surface of the premolar of one premolar after 30-days centered on the incision. Areas of demineralization are shown in the white boxes in the CP PS-OCT (⊥–axis ) and PLM images.