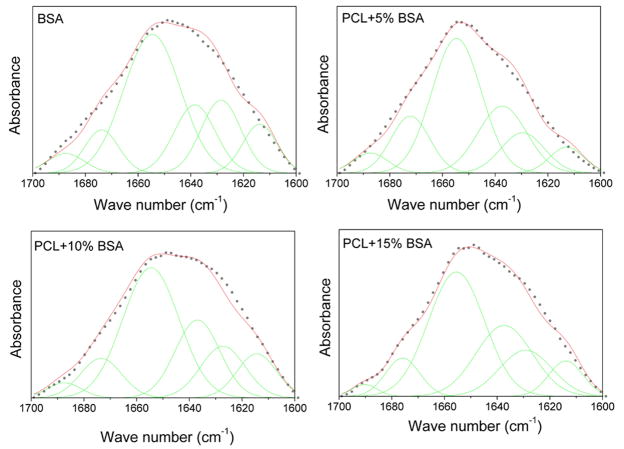
Figure 5.
Infrared spectra of native and encapsulated BSA in the amide I region and their Gaussian curve-fitting. The black broken lines are amide I FTIR spectra overlaid with the result of the Gaussian curve-fitting (red solid lines); the individual Gaussian bands (green lines) are shown as symmetrical peaks underneath the IR spectra. [Color figure can be viewed in the online issue, which is available at www.interscience.wiley.com.]

