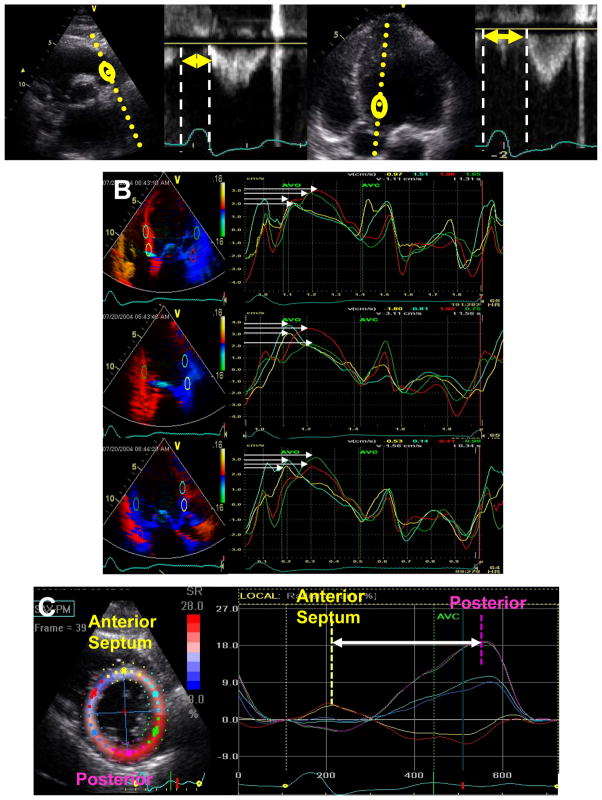
Figure 1.
Dyssynchrony indices included in this study. A: Interventricular mechanical delay calculated as difference between right ventricular ejection (arrow left panels) and left ventricular ejection (arrow right panels). B) Tissue Doppler longitudinal velocity from apical 4-chamber, 2-chamber and long-axis views with time to peak velocity from basal and mid ventricular sites. Opposing wall delay was the maximal difference in time to peak velocity (arrows) of opposing walls form each view, and the Yu index was the 12 site standard deviation. C) Speckle tracking radial strain from the mid-ventricular short axis view demonstrating the time difference between anteoseptum to posterior wall (arrow).

